Category

Wednesday, August 5, 2015

Optimized QVD load

QVD ( QlikView Data) file is a powerful feature of QlikView. QVD is a native QlikView format. It can be only written or read from QlikView. The file format is optimized for speed when reading data from a QlikView script but it is still very compact. Reading data from a QVD file is typically 10-100 times faster than reading from other data sources.

Few advantages of using QVD files include:
  • faster load times
  • Less overhead on Database servers and networks
  • Portability across QlikView applications
  • Incremental Load

Now, lets look into optimized QVD loads. Optimized QVD loads are muck quicker than non-optimized ones. During optimized QVD load, the data is directly sent from disk to RAM memory in the same format. Optimized QVD load is one of the important step in optimizing QVW reload performance.

Optimized mode can be utilized only when all loaded fields are read without any transformations , though the renaming of fields is allowed. A WHERE clause causing QlikView to unpack the records will also disable the optimized load. However, simple Exists() function on a single field is allowed.
Some of the operations that can make QVD load non-optimized are
  • Join 
  • Mapping load 
  • Derivations / calculated fields 
  • Where clause
Things that are allowed in optimized QVD load are
  • Renaming the fields 
  • simple exist() function on single field to filter the records 
Optimized QVD load is indicated in Script Execution Progress window. "qvd optimized" text is displayed whenever QlikView uses optimized QVD load to read the QVD file. However, "qvd optimized" text does not appear in log files.


Sunday, April 20, 2014

Qlikview Script from QVD Files

QlikView stores some metadata with qvd files in the qvd header section. This information is in the form of XML and includes name of thw qvw that generated qvd, field headers, length, format etc.
Along with this information, you will also find code that is used to create the qvd file like Load, SQL select statements and store statements along with database connection string.
There are 3 ways to get the script code from the qvd files.

Text editor: 
If the QVD file is moderately small size, you can simply open the  QVD file with Text editor like NotePad++ and look out the contents of the QVD file.  The file starts with xml version info followed  <QvdTableHeader> which marks beginning of the header section.
At the end of the header section, SQL statements, Load, Store statements and data base connect statements are enclosed between <Statment> </Statement> tags and <LineageInfo> </LineageInfo> tags.
Please be careful before opening any huge QVD file with text editor as it may freeze the system. The other options mentioned below are ideal to huge QVD files.

QlikView Desktop:
Click on Table Files in script window and select the QVD file. Once dialog window opens with QVD preview, select Xml radio button. Under the tables section, select  QvdTableHeader/Lineage/LineageInfo to view the code.
QVD import window

EasyQlik QViewer:
As mentioned in one of my earlier post, EasyQlik QViewer is an useful tool to view QVD contents.
Open the QVD file with EasyQlik QViewer tool and navigate to View -> File Metadata. It pops up a File Metadata window and displays the code.


Feel free to comment, if you are aware of any other method to get the code from QVD files.

Import and export Qlikview documents into XML files

Qlikview provides option to export Qlikview documents into set of XML files. Once, you have created an XML files, it can be used to recreate the Qlikview application. 
Lets look at how to export the document into XML files.

Under Menu select File -> Export ->Export document and layout.

QV Document Export

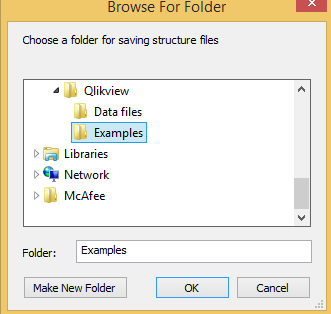
Select the folder and click on OK. I suggest you create a new folder.

Browse Folders

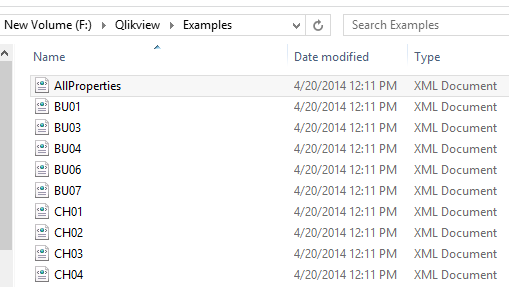
Now open the folder and you will notice few XML files created.  These XML files contain metadata about the Qlikview document. This information can be used to recreate the Qlikview document.
Export option does not export the data from Qlikview document.

XML files

Now, lets look at how to recreate the Qlikview document from the XML files.
  1. Copy the folder and paste in to another folder.
  2. Rename the copied folder to have suffix "-prj". e.g: If the folder name is "Export example" , rename it to "Export example-prj".
  3. Create an new empty Qlikview document (no code, no objects) and save it in the same path as the folder copied in the above step with the same name as folder name without "-prj". e.g: "Export example.qvw"
  4. Close the empty Qlikview document created in step 3.
  5. Navigate to the folder where the Qlikview document is saved and open the Qlikview document.


Project folder


Surprise! the empty document we saved few minutes back has got the nice layout and script code. The layout and code is exactly same as the document exported. But, without the data.  You can now reload the document and save the document with data.

Thursday, April 3, 2014

Partial Reload for Fast and Selective Reloads

How many times you have loaded huge application for hours and realized you either missed a table or need to reload data in a table. But, refreshing the application takes long time. This is where Partial Reload comes into play.
Partial Reload allows Qlikview applications to add or replace selective tables into the data model while retaining already existing tables unaffected. Due to selective tables load, full reload is eliminated and reload becomes faster.

Partial Reload option is available File menu option or invoked using Ctrl+Shift+R shortcut key.

This command executes only those load and select statements that are preceded by a replace or add prefix. Other data tables remain unaffected by the command. 
Note that, It also executes any other statement (excluding normal load and select) in the script such as drop, join, keep etc.

Let's look at the usage of 2  prefixes:
add load, replace load examples
ADD  - This prefix is used to add ( or create) a new table to the existing data model.

REPLACE - This prefix is used to replace an existing table in the data model. New table name should be identical to the existing table name. If the table does not exist already, new table is created and added to the data model.

ADD/REPLACE load statements are treated just like any other load statements during regular reloads. By using ONLY keyword we can restrict ADD/REPLACE load statements execution to partial reloads only. During normal reloads these ADD ONLY / REPLACE ONLY load statements are ignored.

ONLY example

During Partial Reload, to avoid executing any other statements apart from ADD/REPLACE loads,  we can use IsPartialReload() function. This function returns -1 (True) during partial reload and 0 (False) during normal reload.
During development or testing, if a table needs to added or reloaded without affecting other tables in the data model, use the code snippet in the first tab of the script.
IsPartialReload() example

We can also use  IsPartialReload() to execute any Qlikview script statements such as drop tables, drop field to manipulate the data model  or store tables in the qvw into QVDs etc.
IsPartialreload() example -2

Partial reloads are extremely useful during coding and testing phase of Qlikview dashboard. It saves lot of reload time, makes debugging and testing faster.


Monday, March 24, 2014

Custom Sort in Qlikview

In one of my dashboards,  user asked me to create a pivot table that displays assets for top 10 dimension values and everything else grouped and displayed under 'Other'. So, at most the pivot table will have 11 values displayed in the dimension. This requirement can easily be achieved by creating calculated dimension using aggr () and rank () function as explained in my earlier post.
However, the tricky part was the custom sorting requirement. The dimension values need to be sorted in alphabetical ascending order but 'Others' should to be the last value.
After trying several work arounds, I solved custom sorting requirement using match () function. Under Sort tab in chart properties, selected Expression and  used following expression:

Match (aggr (if (rank(sum (Assets))<=10, Currency,'Others'), Currency),'1','2','3','4','5','6','7','8','9','10','Others')


I also selected Text A -> Z.

As you may know, Match() takes input string (aggr() expression in this case) and range of values. It returns the position of the input string in the range values. If the string is not found, it returns 0. In this scenario, it simply returns 11 for 'Others' and 0 for everything else.

This made 'Others' to be sorted as last value (11th position) and everything else is sorted in alphabetical order.

Custom sorting in Qlikview can also be achieved by creating an inline table with 2 columns, containing dimension value (same name as actual dimension column) and sort order ( numeric column with sort order numbers).  Qlikview associates dimension column with actual dimension in the data model. While sorting in UI, we can select expression and use the sort order column from the inline table for custom sort order. 
But , this was a different case as the dimension values are constantly changing and too many dimensions to code the inline table.

Feel free to comment if you know any other alternative or better solutions

Sunday, March 23, 2014

Some Useful Tools and Links

In this post , I'm trying to document some useful Qlikview tools that I often use to make Qlikview application development better, faster and easier.

Nested If-statements Generator
How many times you have struggled get a complex, nested if statements correctly. This online tool by Stefan Walther makes it quite easy to write the nested If statements.
Tool link
Documentation

Set Analysis Wizard for Qlikview
Stefan Walther created one more online tool to create Set analysis expressions along with documentation.
Tool link
Documentation

EasyQlik Qviewer
Often we run into situation where we need to open and analyze the QVD files. To examine the QVD content, the only easy way is to load the QVD into QVW.
EasyQlik Qviewer comes handy in these situations. It is a fast and lightweight standalone file viewer for analyzing Qlikview's QVD files. This helpful tool has many features apart from opening the QVD files.
It speeds up analysis and debugging and saves lot time. Though Its a paid tool, trial version is available with some limitations.
Link

Document Analyzer And Other Useful Tools
Rob Wunderlich has developed some of the very useful Qlikview tools. I particularly use
DocLog Analyzer. This tool will load qvw document logs from a directory and provide visualization of where time is spent in a script.
Link to All Tools

Qlikview Optimizer
This application uses .mem file to provides insight into RAM usage of qvw document. 
Tool link

QlikView Notepad++ Language Definition
This custom language definition for Notepad++ developed by qlikviewaddict provides convenient platform to edit qlikview load scripts and qvs files. The QlikView Custom Language Definition for Notepad++ gives basic syntax highlighting, auto-completion and code tool-tips when working with QlikView script files in Notepad++.
Tool link


Qlikview Data Profiler
This handy tool by Steve Dark provides quick and easy way of viewing the data that is in the qvw application. It is basically a QVW file with list box, table and other objects. These objects can be copied and pasted into any Qlikview application to view the data of that document.
Link to Data Profiler Page

Qlikview Power Tools
Power Tools is a small utility program or application that aid in performing a specific functionality or that extends QlikView functionality in some other way. The Power Tools are not supported and is seen as use-as-is tools, supplied separate from the QlikView product suite.
These tools are mostly helpful in managing server side activities.
Link to Power Tools Page


Qlikview Server CAL Manager
This application provides insights into server CALs allocation and usage. It can also delete the unused CALs after a defined number of days.


I'm sure there are many other useful tools that's missing from the list. Feel free to comment if you know of any.

Saturday, December 7, 2013

QVS file - Reusable Qlikview Scripts


qvs (QlikView Script) files allows  developers to store QlikView load scripts into a external script file. The external script (qvs) file can be referred in multiple qvws.  Usually, script file with QlikView Script code is saved with .qvs extension. However, the file extension does not matter.

It always a good practice to store common script code into qvs files and include the script files in required qvws.
e.g: Calendar table code is often same in most of the Qlikview dashboards. Instead of replicating the same script in each and every dashboard, the Calendar table script can be stored into a qvs file and same can be referenced in required Qlikview applications.
This practice removes duplicating the same code in multiple applications and makes the maintenance easier.  Any update to code are made in single place eliminating redundant effort. Also, Qlikview application script now looks cleaner.

include or must_include statement is used to refer the external qvs files in Qlikview applications.
e.g:
Include examples

 $(include=load_script.qvs);
 $(must_include=load_script.qvs);


While script execution, Qlikview will replace the include statements with the code from the external qvs file.

While INCLUDE and MUST_INCLUDE serve the same functionality the major difference is must_include aborts the execution if the Qlikview cannot locate and load the external script file, while "include" statement skips the statement and moves onto next statement.

I usually use Notepad++ to edit the QVS files. Since, qlikviewaddict has developed custom language definitions for Notepad++ editor for Qlikview scripts with syntax highlight, auto-completion and tool tips feature. Refer my post for more details.

Saturday, July 13, 2013

CSV Reports from Qlikview Dashboards

I recently came across a requirement where in the client wanted us to automate daily email delivery of a csv/excel file containing data of a straight table from one of the Qlikview app. Obviously, Qlikview publisher has the capability to create and email pdf reports from Qlikview apps, but it does not have options to create csv/excel reports. We started evaluating multiple options to achieve the requirement.

We coded a macro to export the table into excel file and created a trigger to execute macro code on Post Reload of the app and later use a batch file to email the excel file using sendemail.exe .


The trigger appears to work when the app is refreshed manually through Qlikview desktop. However, when the refresh is triggered through publisher tasks, the trigger doesn't work.

After trying many unsuccessful workarounds, we decided its time think other ways to achieve the requirement.
One of the idea that came from my colleague is to create the csv file using load script in the Qlikview app. That sounds simple and does not require any complex macro script and triggers!!

We modified the load script to create a Qlikview table in the app with data required for reporting. Then added store command to save the file with .csv extension on the server.

We created tasks on publisher to reload the app and while reloading the app , it creates a csv file on the server. We created batch file for emailing the .csv report to user and set up the dependency on the app reload and email script using enterprise scheduling tool like OpsWise or Control-M.

The method has its limitation but works like charm for simple requirements. Feel free to comment any suggestions to improve the process or any other ways to achieve it.
There are third-party tools like NPrinting which enables rich and advanced reporting features with excel and many other formats. But, comes with a cost.

Tuesday, March 12, 2013

Auto Generate Sample Scripts

Qlikview provides a sample script, that can be used to create several dummy tables and test app.
This feature is useful when you are planning to practice creating Qlikview charts, tables and other visualization objects and you just need some sample data to start with.

To use the Qlikview provided sample script,  follow below simple steps.

1) Go to File --> Script Editor  or Press Ctrl + E
2) Click on Insert  ->  Test Script or Press Ctrl + Q twice


This will insert sample script in script editor. Save the app and reload to run the script.
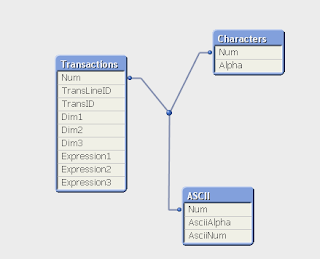
Once the script excution is Click on File --> Table Viewer or Press Ctrl + T to open the Qlikview data model.


Now the script and sample data is ready, you can start creating charts and tables for the app.


Please keep in mind that the script generated by Qlikview heavily relies on rand() function for generating data and does not use any other source.

Wednesday, March 6, 2013

Top N in Qlikview Straight/Pivot Tables and Charts

Often we want to display Top N values in Qlikview straight/pivot tables and charts. This requiers restricting dimension in the chart/table to display Top N records based on the metric.
We can use aggr( ), rank() and sum() functions together in dimension to achieve the same.

For example, Create a Pivot table to display Gross Revenue and Gross Room Nights for Top N (top 10 in this example) Hotel Markets based Gross Room Nights.

Right on the sheet and Add New Sheet Object --> Chart
Select Straight Table and click Next button.

Dimension: Click on Add Calculated Dimension and add the expression
aggr(if(rank(sum([Gross Room Nights]))<=10,[Hotel Market]),[Hotel Market])

This will limit Hotel Market to Top 10.


Displays Top 10 Markets based on the gross room nights metric. Remaining markets are displayed in single record as null with '-' symbol in the table.
You can suppress the null record by Clicking on the dimension and selecting Supress When Value Is Null option on Dimensions tab

Label the calculated dimension as Hotel Market.

Click on Next button and add following expressions and label them appropriately.

Expression 1 : sum([Gross Room Nights])
Expression 2 : sum([Gross Revenue])

Click on Finish button.

Table now displays Top 10 markets and Gross Room Nights and Gross Revenue for the markets.

Hope this example helps!

Note: Above expression can be sightly altered to display Top 10 Hotel Markets and everything else labeled as 'Others'.
aggr(if(rank(sum([Gross Room Nights]))<=10,[Hotel Market],'Others'),[Hotel Market])


Thursday, February 14, 2013

How To Install Netflix in Ubuntu 12.10

Until recently, watching Netflix on Linux was not possible since Silverlight was not available on Linux. Finally, Netflix is available in Ubuntu 12.10 in the form an unofficial app. I have used it and it works great.
Installing Netflix on Ubuntu 12.10 is quite simple.

Here are the steps:
  1. Open up a terminal window
  2. Type sudo apt-add-repository ppa:ehoover/compholio and hit Enter
  3. Issue the command sudo apt-get update
  4. Issue the command sudo apt-get install netflix-desktop
  5. Say OK to dependencies and Installation will begin.
Depending on the network speed, this could take some time. Once that’s over.
  1. Open the Unity Dash
  2. Type netflix  and NetFlix app will appear.
  3. Click on the Icon and Enjoy your movies!
Note this is a work around and  not an official app from Netflix and is not supported from Netflix.

Tuesday, February 12, 2013

Line Chart Trick to Avoid Horizontal Scroll Bar

Often line chart in Qlikview apps  are displayed partially due to space limit on the sheet. When the chart is stretched the the lines starts appearing completely.
To make the lines on the chart appear completely either chart needs to stretched or chart properties needs to updated to have horizontal scroll bar (presentation tab).
Horizontal scrolls works most of the time but they are annoying sometimes.
Do you want to display the line on the chart completely without stretching or scroll bars?
Follow the simple trick to cheat Qlikview to make it display complete chart without horizontal scroll bars.

1) Right  click on the line chart and open the Properties.
2) In General , select Bar Chart as Chart Type
3) In Presentation tab,  select"Show All Bars" check box.
4) Now, go back to General tab and select Line Chart as Chart Type.
5) Click OK

Line chart now displays complete line and horizontal scroll bar is suppressed.

Hope this helps!

Alternative to Count Distinct

Count distinct "Count( Distinct <Field Name>)" is an expensive expresssion in Qlikview. Whenever used, it turns Qlikview to use single core instead of multi-cores resulting in slow performance of the app.
By making a small change in data model we can replace COUNT DISSTINCT with SUM function and improve the app performance marginally and increase app response time to users actions.

To achive this add another field in Qlikview table having value 1 along with the field you need to count.

Example:

Bookings:
LOAD
    [Member Id],
    [Booked Date],
    [Transaction Id],
    [Booking Amount]
FROM Bookings.qvd (qvd);

"Member Count":
LOAD
    [Member Id],
    1 AS "Unique Members"
Resident Bookings;

To count distinct members
COUNT(DISTINCT [Member Id]) can be replaced with SUM([Unique Members]).