Qlikview provides a sample script, that can be used to create several dummy tables and test app.
This feature is useful when you are planning to practice creating Qlikview charts, tables and other visualization objects and you just need some sample data to start with.
To use the Qlikview provided sample script, follow below simple steps.
1) Go to File --> Script Editor or Press Ctrl + E
2) Click on Insert -> Test Script or Press Ctrl + Q twice

This will insert sample script in script editor. Save the app and reload to run the script.
Once the script excution is Click on File --> Table Viewer or Press Ctrl + T to open the Qlikview data model.
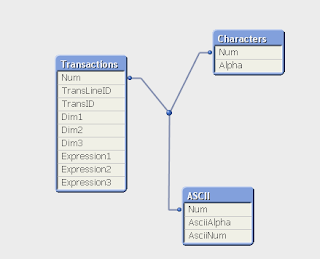
Now the script and sample data is ready, you can start creating charts and tables for the app.
Please keep in mind that the script generated by Qlikview heavily relies on rand() function for generating data and does not use any other source.
This feature is useful when you are planning to practice creating Qlikview charts, tables and other visualization objects and you just need some sample data to start with.
To use the Qlikview provided sample script, follow below simple steps.
1) Go to File --> Script Editor or Press Ctrl + E
2) Click on Insert -> Test Script or Press Ctrl + Q twice

This will insert sample script in script editor. Save the app and reload to run the script.
Once the script excution is Click on File --> Table Viewer or Press Ctrl + T to open the Qlikview data model.
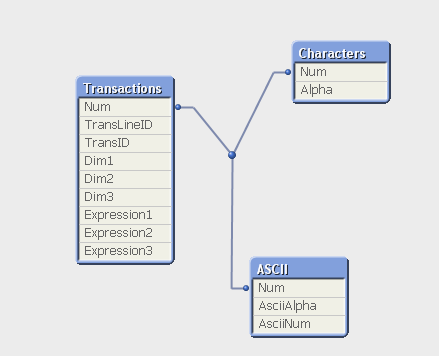
Now the script and sample data is ready, you can start creating charts and tables for the app.
Please keep in mind that the script generated by Qlikview heavily relies on rand() function for generating data and does not use any other source.
